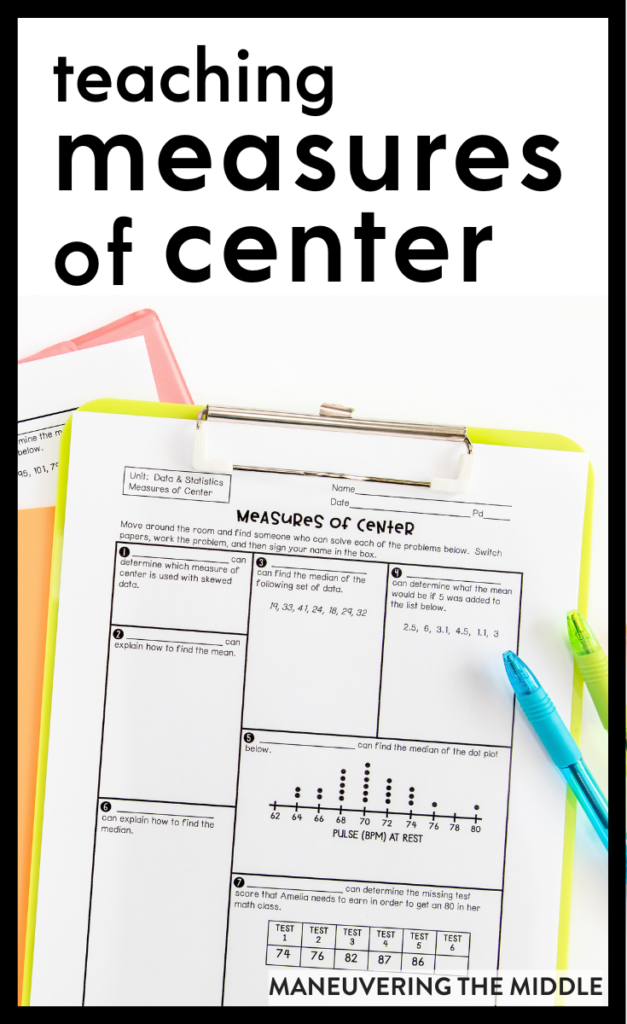
Mean, median, and mode – my favorite measures of center! Let’s discuss this 6th and 7th grade skill as well as tips for teaching and real-life applications.
Vertical Alignment
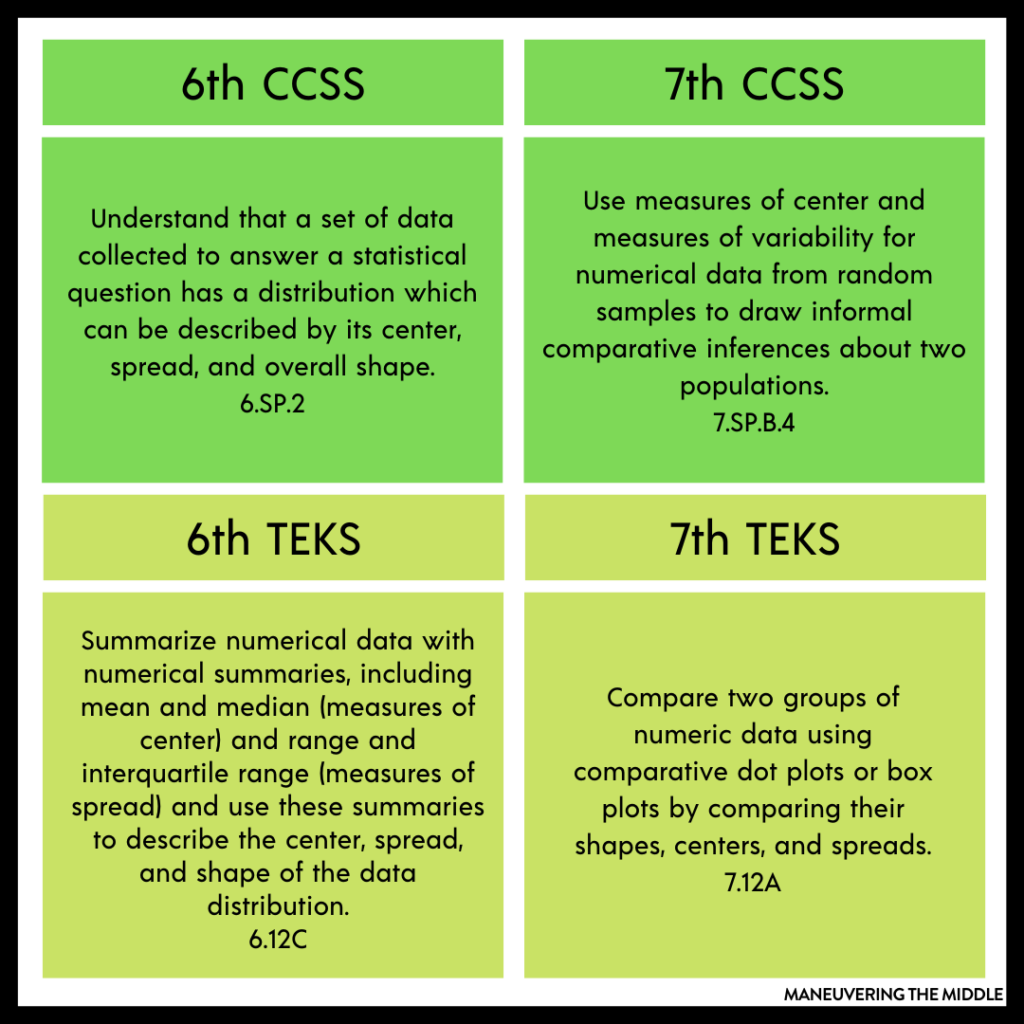
6th Grade Standards – Understand that a set of data collected to answer a statistical question has a distribution which can be described by its center, spread, and overall shape. 6.SP.2
Summarize numerical data with numerical summaries, including mean and median (measures of center) and range and interquartile range (measures of spread) and use these summaries to describe the center, spread, and shape of the data distribution. 6.12C
7th Grade Standards – Use measures of center and measures of variability for numerical data from random samples to draw informal comparative inferences about two populations. 7.SP.B.4
Compare two groups of numeric data using comparative dot plots or box plots by comparing their shapes, centers, and spreads. 7.12A
STAAR Test Questions
I’ve written it one million times, but after I read a standard, I want to then look at the difficulty of the aligned test questions from a standardized test to make sure I am covering the complexity of the standard. Texas has recently overhauled their state testing to include various types of problems (ex: drop downs, multiple select) as you can see below.
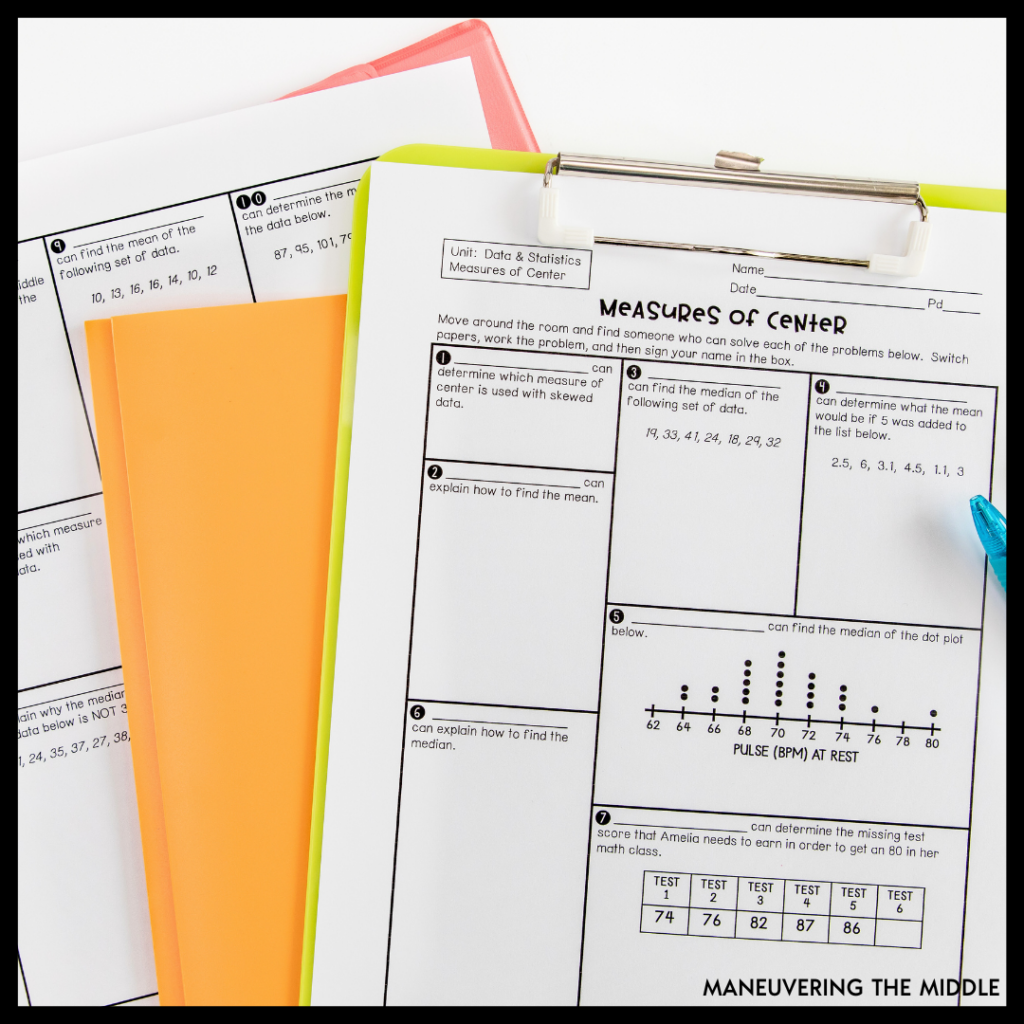
6th Grade 2024 Released STAAR Test
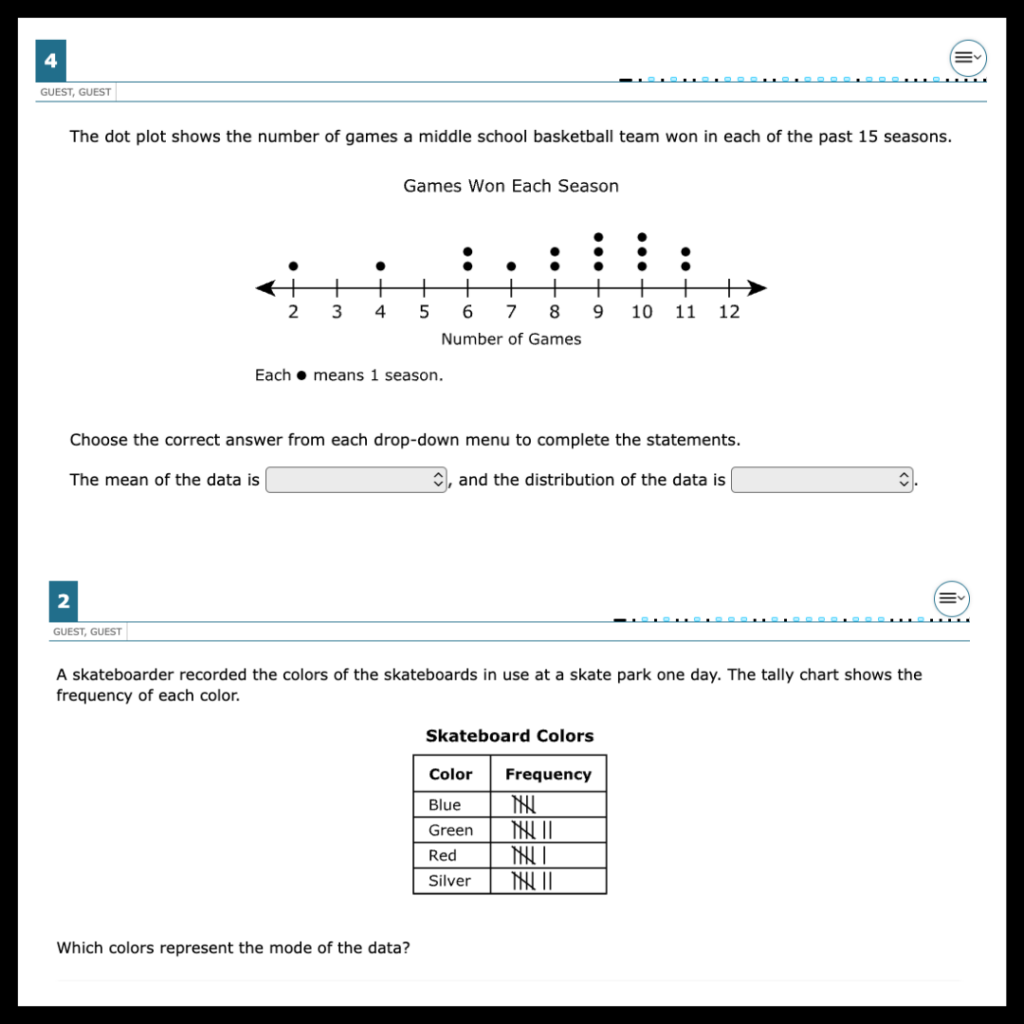
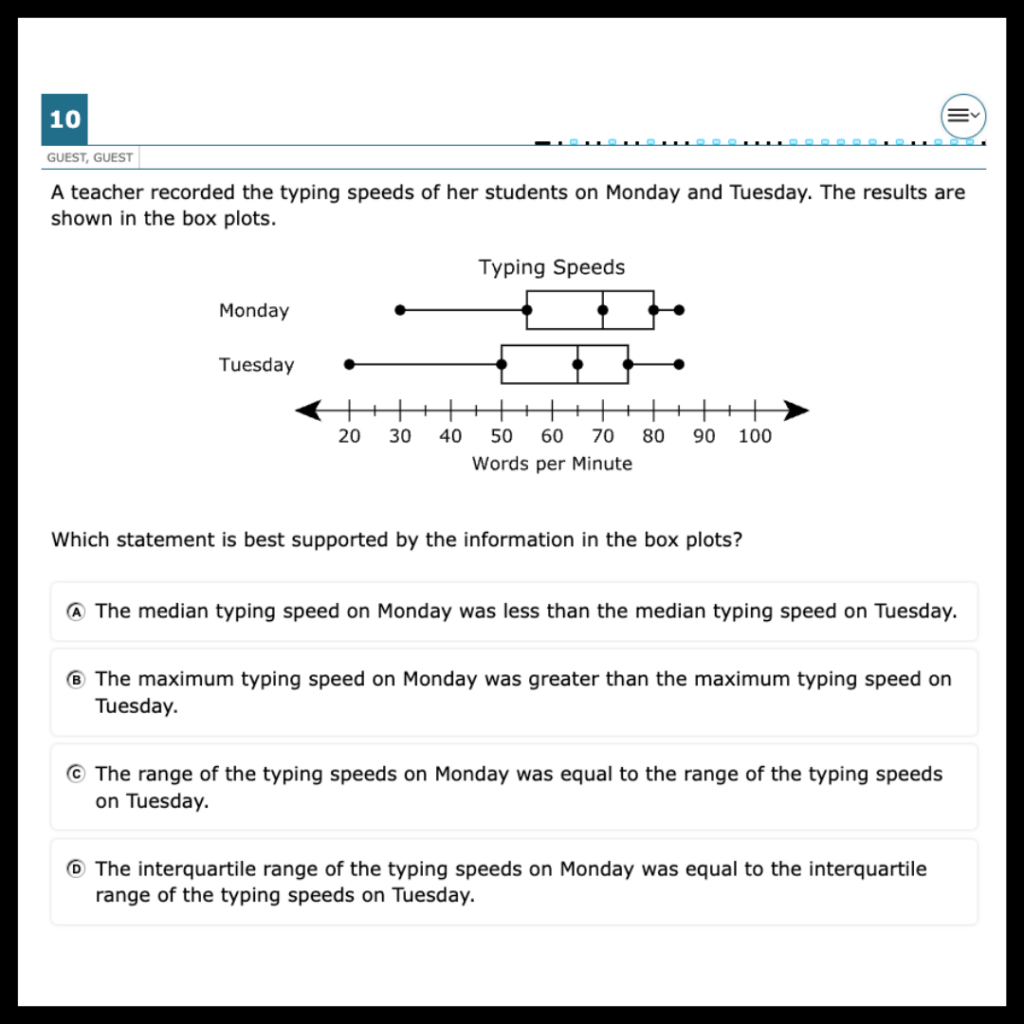
7th Grade 2023 Released STAAR Test
A few observations right off the bat:
- Students have to analyze dot plots, box and whisker (box plots), and frequency tables in order to answer questions about measures of central tendency.
- Students need to be able to compare measures of center to measures of spread.
- Students will need to describe the shape as symmetrical and asymmetrical.
- Students will NOT be given a list of numbers and be asked directly to calculate the mean and median.
Vocabulary
Measures of center is vocabulary rich! There are many definitions and 75% of the words start with M, so it is easy to mix them all up. Here are a handful of ways to help your students remember what each word means:
To the tune of Row, Row, Row Your Boat – Two Options
Add, add, add, divide, that’s how you get the mean | Mode is the one you see the most | And median’s in between
Hey, diddle diddle, the median’s the middle | You add then divide for the mean | The mode is the one that you see the most | And the range is the difference between
While these little rhymes don’t include interquartile range for 6th and 7th graders and mean absolute deviation for 7th graders, they are a start. If you have a song or rhyme for these words, let us know in the comments.
Essentially students need to know that:
- Mean is the average. It is the fair share or the balancing point of the data. It is found by adding the data points together and dividing by the number of data points. Ex: (M + E + A + N)/4
- Median is the middle numbers of a data set when the numbers are listed in numerical order. Ex: MEDian is the middle like in a Small, MEDium, and Large situation
- MOde is the MOst (Mode is not explicitly a part of the TEKS or CCSS, but it does pop up in other state standards)
If you can force students to write words like “middle” or “average” when they see these words in their work, they will internalize them faster.
Of course, I will always encourage you to have these words with their definition and an image visible on your classroom walls for students to reference. You can make an anchor chart with some thick markers and poster board, but you can always grab our Word Wall resource.
No results found
You can try clearing any filters or head to our store’s home
WHAT IS MANEUVERING THE MIDDLE?
If you find this information helpful, consider checking out more of our resources! At Maneuvering the Middle, we design and develop standards-based math resources for grades 5 – Algebra 1. Our curriculum provides high quality, engaging resources for students and provides teachers with planning resources and plenty of training.
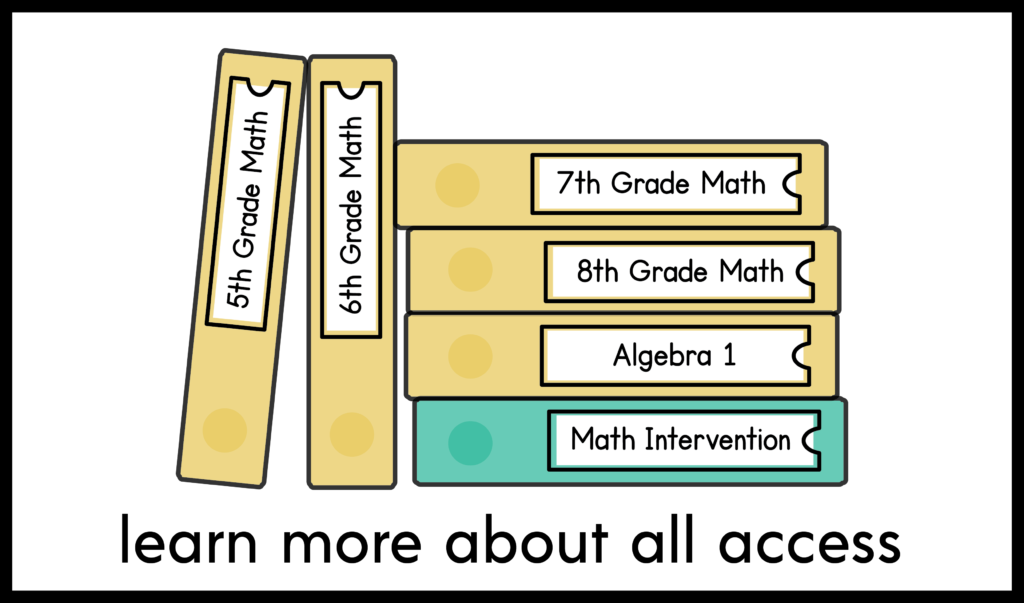
- All Access: standards-based, on-level curricula available for grades 5 – Algebra 1
- Maneuvering Math: a skill-based intervention program for middle school math students
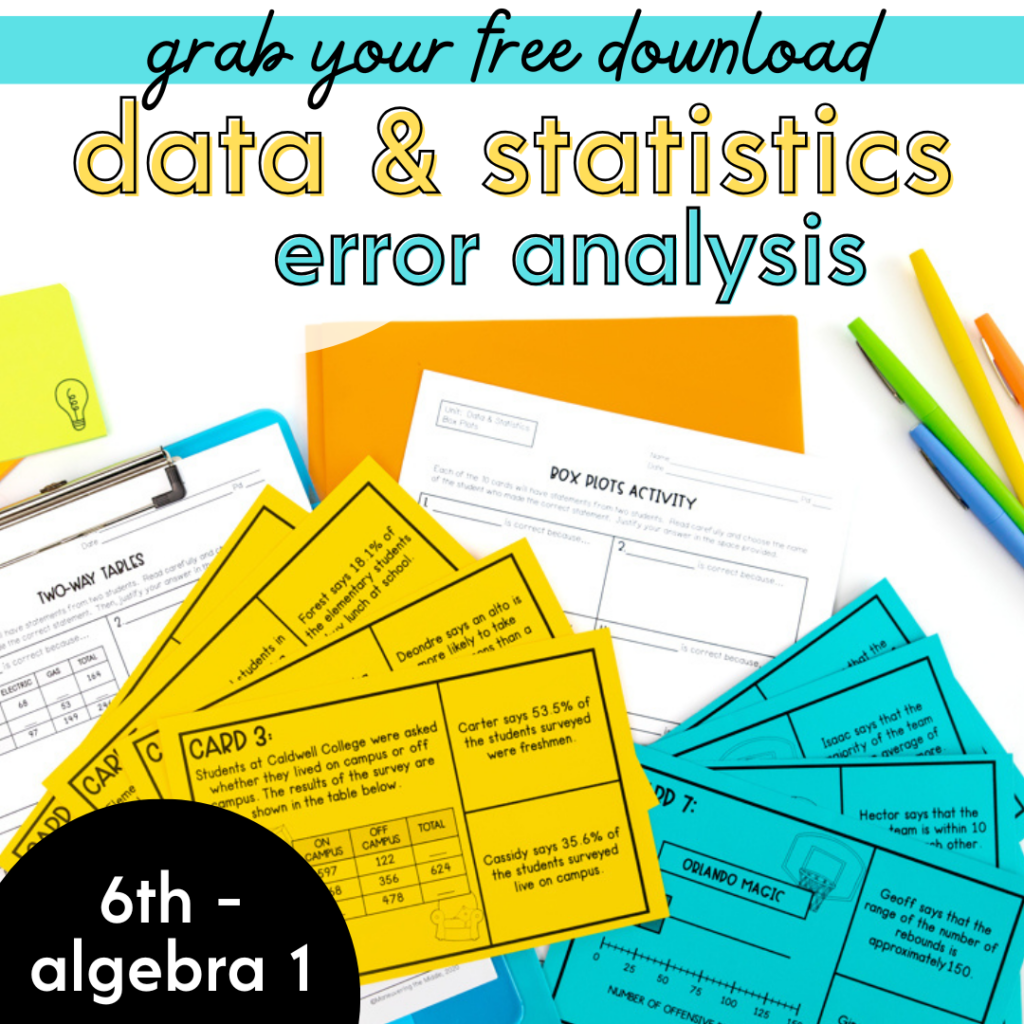
While we have you, grab our Data and Statistics freebie! It has a Box Plot Activity and Two Way Table Activity.
How to Sequence
Measures of center (and spread) should be taught as close to the beginning of your data and statistics unit as possible. Students will need to answer questions about measures of center using the graphs (dot plots, box and whisker plots, frequency tables) that you will need to introduce shortly after. In addition, 7th graders will be expected to look at two different types of graphs and compare their measures of center.
While you can introduce all of the Measures of Central Tendency – mean, median, mode, range, interquartile range – at once, I highly recommend separating these into:
- Day 1 – Measures of Center (Median and Mean)
- Day 2 – Measures of Spread (Range and Interquartile Range for 6th + Mean Absolute Deviation for 7th)
Real-Life Application
Measures of center have many real life applications to students! I would start with what students are most familiar with or can physically see:
- Calculate their math average or the class average
- Calculate the median height by lining up your students from shortest to tallest
- Provide a menu from a local restaurant and ask students to calculate the median and mean of the appetizer, entrees, and desserts
- Ask students to choose an athlete or team and calculate the mean and median points of a given season.
- Calculate real estate mean and median prices using Zillow or Realtor.com. Ask students which measure of center best represents a specific neighborhood or page 1 of the search results.
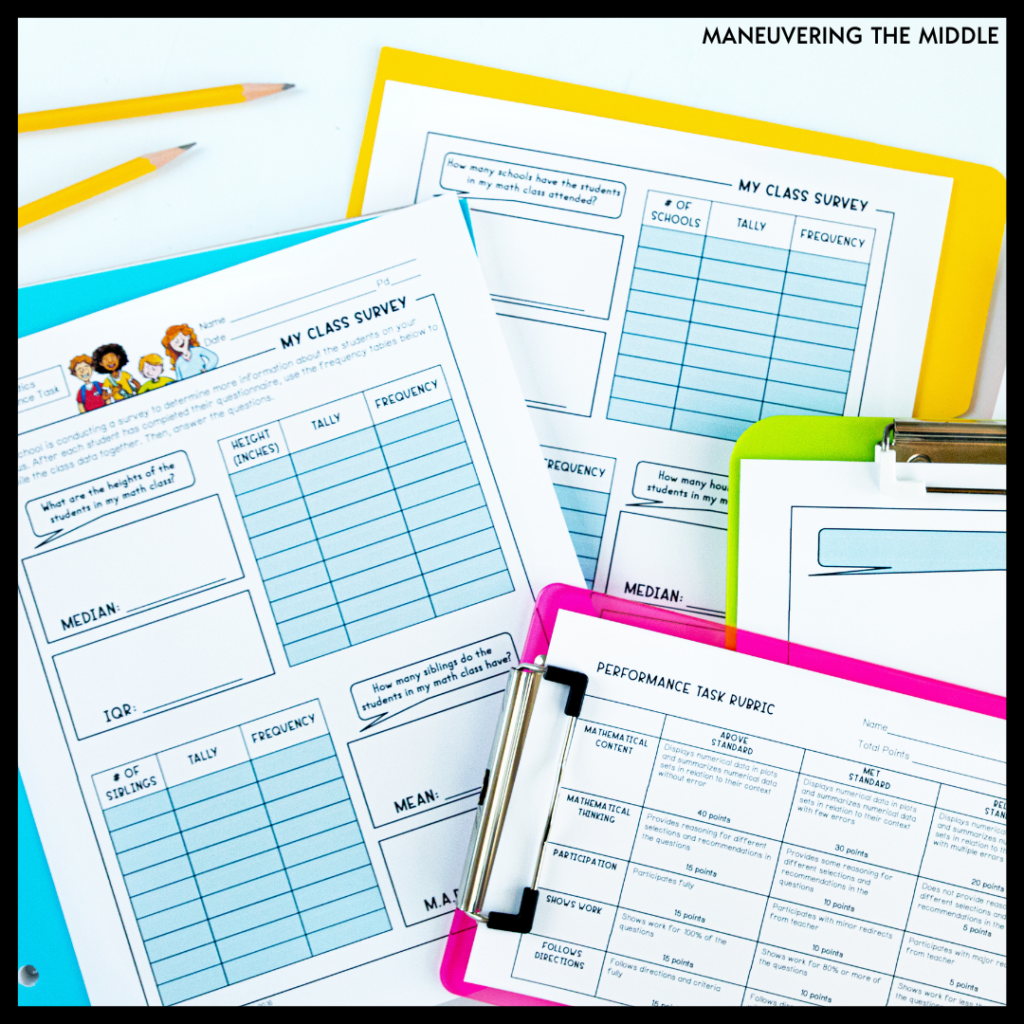
- Our Data and Statistics Unit Review Performance Task for 6th grade is the perfect encapsulation of everything! Students survey their class with 4 questions and use the data to create frequency tables, dot plots, box plots, or histograms. This performance task is included in our All Access math membership or in our 6th Grade Data and Statistics Activity Bundle.
What tips do you have to teach mean and median?